Exploiting a classic buffer overflow vulnerability
Hello there. In this tutorial we are going to learn Linux exploit development. We use Protostar Linux VM for this purpose. Protostar was developed by exploit-exercises.com. Unfortunately the host site is now down. Anyway, you can download the ISO from the internet — just Google it. First, download it and use VirtualBox or VMware as the virtualization software.
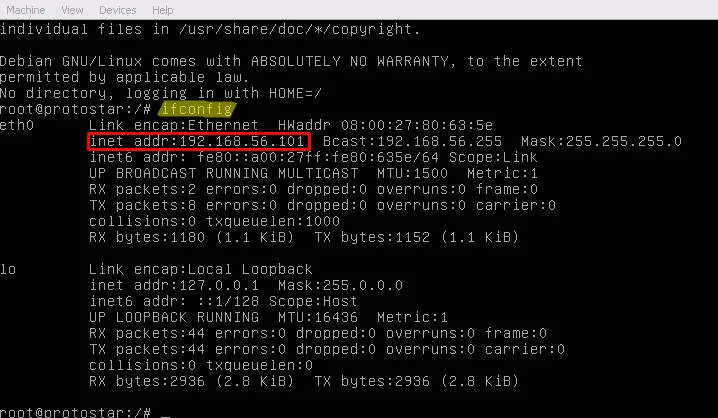
As the first step, boot Protostar and log in as root. Default username/password are root:godmode. After logging in as root, use ifconfig to get the IP of the machine.
Now you can use SSH in Linux or PuTTY to access our victim machine. This time you have to log in as a normal user. Default credentials are user:user.
There is one more thing to do before you actually start the learning process. Change your shell to bash by entering bash. With bash you have more power than with the default sh shell.
Now the interesting part begins. All of the challenges are located inside /opt/protostar/bin.
So use:
cd && ls cd /opt/protostar/bin && ls
There are 25 levels to play, which can be divided into the following main categories:
Stack-based buffer overflows
Heap-based buffer overflows
Format string exploits
The easiest part to understand is stack-based exploits. Even if you are new to exploit development, you can understand what’s going on. The first level you want to try is stack0. It’ll teach you how function calls happen, how stack frames are built, and how to overflow data outside an allocated buffer.
Let’s see what we have to do.
./stack0
Just enter a string and see what happens. It will say to retry.
We have the source code as well, but actually it doesn’t help a lot. Just try to get an idea of what is happening.
#include
int main(int argc, char **argv) { volatile int modified; char buffer[64]; modified = 0; gets(buffer); if (modified != 0) { printf("you have changed the ‘modified’ variable\n"); } else { printf("Try again?\n"); } }
First it declares two variables called modified and buffer. The size of buffer is 64 bytes. After that it takes a string as input from the user and copies that into the buffer space. This code doesn’t do any kind of bounds checking before copying data into the buffer. It doesn’t care if the supplied string is larger than the buffer space. Buffer overflows occur in such situations.
Did you note something special when declaring the modified integer? Why is there a volatile keyword? First we set modified to zero. In this code it’s never changed, and after that there is an if statement that checks whether the integer is equal to zero or not. What a joke, right?
When the compiler sees this, it will optimize away the if statement because it knows modified is never changed. That’s why the volatile keyword is used in the code above. It says to the compiler, “Hey GCC, don’t assume the integer value is constant — it may change at runtime :-)”
Now it’s time to disassemble the binary and see the inner working of it. We use GDB for this. Let me introduce our awesome tool, GDB — the GNU Debugger. By using a debugger we can see how things are happening inside the machine code. In the following screenshots I used Intel syntax for assembly:
set disassembly-flavor intel
The reason to use Intel’s assembly syntax is that it’s clear, user-friendly, and easy to understand.
As the next step, I disassembled the main function. You can see the assembly instructions in the red box.
You can see that I disassembled the main function with:
disass main
There are some hexadecimal values on the left-hand side. Those are memory addresses. Our assembly instructions are stored at those locations. The computer memory is divided into small parts called bytes. You know that one byte is equal to 8 bits. 8 bits can hold 256 values (0–255). Normally we work with 4-byte words.
In the CPU there are five main components for processing instructions:
Data bus
Instruction decoder
Program counter
Arithmetic and Logic Unit (ALU)
Registers
The program counter keeps track of which instruction should be processed now and what’s next. In x86 this is handled by the EIP register. EIP always holds the memory address of the instruction. Now the CPU knows the address of the instruction, so it fetches the instruction and passes it to the instruction decoder. The fetched instruction bytes are opcodes. The instruction decoder interprets the opcodes — for example, opcode 0x5f means pop edi, while opcode 0x45 means inc ebp. The instruction decoder tells the CPU what to do. After decoding, data moves on the data bus and is processed in the ALU. Finally, processed data is saved to memory or registers. OK — I hope you understand what’s going on here.
Instructions like push ebp / mov ebp, esp are not coming from your C code directly. The compiler inserts them to make a stack frame for the function. Let me quickly introduce the term stack.
The stack is a concept used in computer science. In programs we call functions and pass arguments; functions may return values. The stack helps manage function arguments and return addresses. The stack typically begins at a high memory address and grows downward (to lower addresses). We can add something to the stack by using push and remove it with pop. The ESP register always points to the top of the stack.
In the screenshot I set a breakpoint inside the main function using:
break *0x80483f4
You may ask, “Why didn’t you use break main?” If we use break main the debugger may skip the function prologue because it treats it as compiler-generated. Since we want to see how the stack is built, we set the breakpoint at the address of the first instruction.
Next, we use the command i r to see the register contents (i r is short for info registers). Note that EIP is pointing to address 0x80483f4. Do you remember it? That was the address of the first instruction in the disassembly. EIP contains that value because the next instruction to be executed is there — we have stopped execution at the start of the code. The return address is on the stack — that’s where the CPU will go after the function returns.
We can examine the stack in GDB using the x command.
x/x [address] — examine memory in hexadecimal
x/d [address] — examine in decimal
x/t [address] — examine in binary
If we want to examine multiple words beginning from an address:
x/10wx 0xbffff7bc # Examine 10 words in hex at 0xbffff7bc
You can also examine memory at a register directly:
x/30wx $esp
In the image you can see the return address within a green box at the top of esp. Remember that the top of the stack is at the lower memory addresses.
The next instruction is push ebp. The value of EBP should be copied to the top of the stack after this instruction. Let’s see if this is true.
In the blue box you can see a value copied to the stack: 0xbfff838. This is the value of EBP.
Another thing happened: ESP changed from 0xbffff7c0 to 0xbffff7bc (4 bytes difference). Calculate the difference — it’s 4. A register size is 4 bytes. So ESP got reduced by 4 bytes. Why did ESP reduce when we pushed data? Because the stack grows toward low memory. If something is pushed to the stack, ESP decreases. If we pop from the stack, ESP increases.
Next instruction is mov ebp, esp. So EBP should be set to the value of ESP. Now both EBP and ESP point to the top of the stack.
Let’s see this situation in GDB.
I used the ni command (next instruction). ni simply executes the next instruction. In the screenshot you can see that ESP has not changed much here because we haven’t pushed or popped more values.
Next there is and esp, 0xfffffff0. This command aligns the stack; we don’t need to worry much about it. However, ESP is changed accordingly (it goes to a lower address).
The next instruction is sub esp, 0x60. So ESP is reduced by 96 bytes (since 0x60 is 96 in decimal). Where does 96 come from? It’s how the compiler allocates space for local variables on the stack.
You can see it on GDB too:
0xbffff7b0 – 0xbffff750 = 0x60 ==> 96 bytes
OK. What’s next?
mov DWORD PTR [esp + 0x5c], 0x0
This instruction writes zero to the address esp + 0x5c. Since 0x5c is 92 in decimal, a zero is copied 4 bytes ahead of the saved EBP. Can you imagine what this line does? In our C source code there was an int value initialized to zero — this is that value.
Next is:
lea eax, [esp + 0x1c]
lea stands for Load Effective Address. This loads the address esp + 0x1c (i.e., esp + 28) into eax.
After that, eax is pushed onto the stack. Together, these instructions push the argument for the next function. The next thing is a call to gets. The argument to that function was pushed to the stack; when gets executes, it writes data into that memory address.
Let’s see what happens when gets writes input data to the buffer on the stack. Now I enter some As as input to the program. You can clearly see that our input is copied on the stack.
What if I enter a larger number of As? It will overflow into the previous value (modified). How much data is needed to overflow into the integer value? Since our buffer is 64 bytes, if I enter 65 As, the modified variable will get altered.
Now everything is clear. It’s time for extraction. We can use lovely Python for this.
If I run:
python -c "print ‘\x41’ * 65"
in a shell, I can get 65 As printed. So I can pipe this command’s output as input to the stack0 program:
| python -c "print ‘\x41’ * 65" | ./stack0 |
Awesome — we did it. We successfully modified the variable. It was not just one command; we learned the theory.
Now one more thing: what if I enter a much larger input?
We get a segmentation fault. Real happiness begins here. We are going to learn more on this topic in future tutorials.
See you again soon. Thanks for reading.